Interim evaluation of the 15th Medium-Term Management Plan
In April 2023, we set a management policy of “realizing ESG management” and launched the 15th Medium-Term Management Plan (fiscal 2024–2026), which features nine priority strategies. Since that time, however, there have been some major changes in the business environment, including changes in geopolitical risks, continuing high prices of energy and raw materials, and rising labor costs. In particular, the level of uncertainty in the automobile industry has grown at a speed faster than anticipated, including stalling growth in the EV market and changes in the trade policies of the United States.
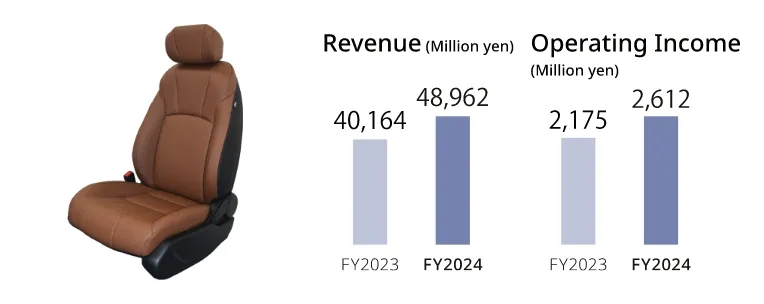
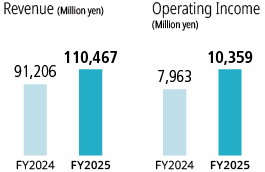
In fiscal 2025, the second year of the 15th Medium-Term Management Plan, the TS TECH Group recorded higher revenue but lower operating income. While the depreciation of the yen contributed to increased revenue, this was partially offset by several one-time factors, including production declines—particularly in China—and impairment losses in Europe. As a result, revenue reached 460.5 billion yen (up 18.8 billion yen year on year), while operating income declined to 16.4 billion yen (down 1.0 billion yen).
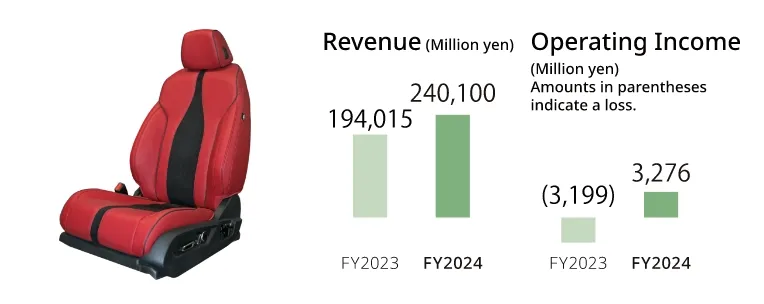
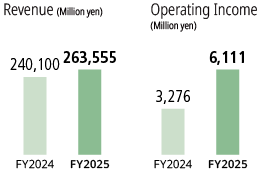
In the Americas region, where we are promoting our “V-shaped recovery in North America” strategy—one of our key priorities—profitability has continued to improve steadily. We achieved revenue and profit growth for the second consecutive year, with revenue reaching 263.5 billion yen (up 23.4 billion yen year on year) and operating income amounting to 6.1 billion yen (up 2.8 billion yen). These results, achieved despite headwinds such as rising raw material and labor costs, reflect progress in building a profit structure resilient to environmental changes, including the introduction of automation equipment and reductions in production losses.
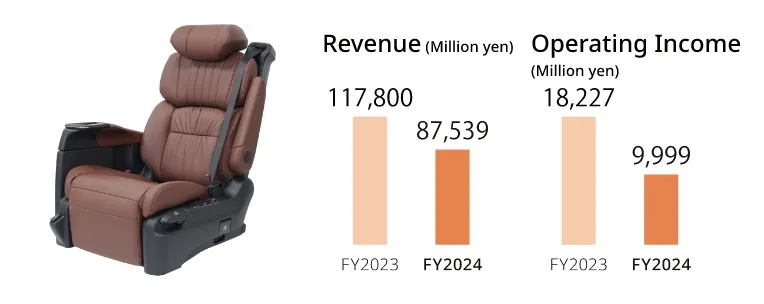
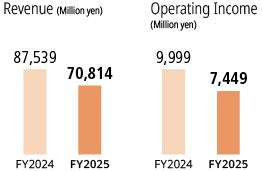
In China, where we are pursuing our priority strategy of “Restructuring the China business strategy,” revenue declined to 70.8 billion yen (down 16.7 billion yen year on year) and operating income to 7.4 billion yen (down 2.5 billion yen), due to a decline in Japanese automakers’ vehicle sales amid the rise of local Chinese EV manufacturers. Despite the decline in both revenue and profit, the segment maintained a relatively high operating margin compared to other regions. Looking ahead, we expect the business environment to remain challenging. To stay competitive in the Chinese market, we will continue to optimize our production structure, reduce costs by leveraging local suppliers, and accelerate efforts to secure new commercial rights from local automakers.
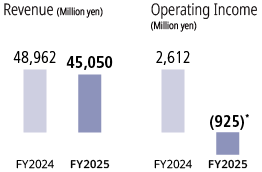
For fiscal 2026, the final year of the 15th Medium-Term Management Plan, we are projecting revenue of 430 billion yen (down 30.5 billion yen year on year) and operating income of 16.5 billion yen (up 100 million yen), factoring in earnings pressures such as production declines—particularly in the Americas and China—and foreign exchange effects. To achieve these targets, we will continue implementing cost-reduction initiatives. Despite ongoing volatility in the business environment, the Group’s profit structure has continued to evolve steadily. Looking ahead, we will advance a range of initiatives aimed at expanding sales—including in new business domains—and further strengthening profitability.
Strategically allocating resources for sustainable growth
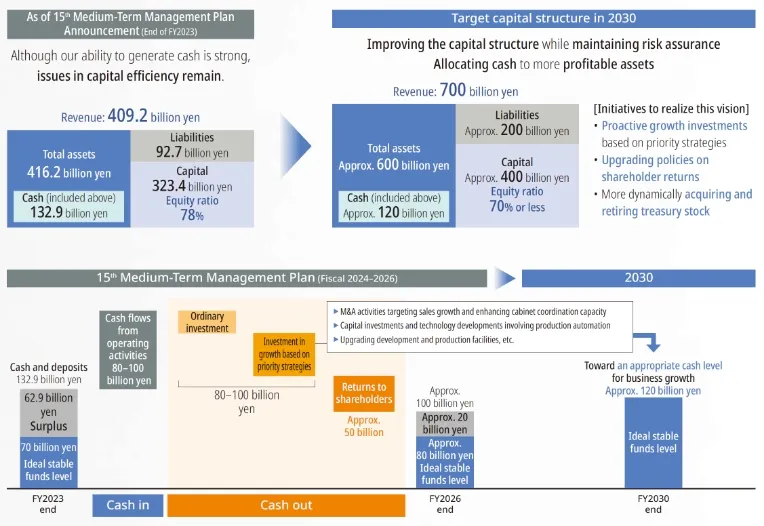
Backed by the solid financial foundation we have built over time, the Group has worked to improve its capital structure while maintaining sound financial health, in pursuit of our 2030 Vision. We will maintain this momentum by allocating cash to higherreturn assets, aiming to drive further growth.
Specifically, looking ahead to fiscal 2030, we have defined an appropriate level of cash reserves based on the scale of business operations we envision. By strategically allocating funds in excess of that level to growth investments and shareholder returns, we aim to further enhance corporate value.
In terms of growth investment, in addition to the capital required for regular business operations, we are advancing a wide range of initiatives, including expanding new business opportunities (such as those with Maruti Suzuki India Limited), securing cabin coordination capabilities centered on next-generation technologies, deploying production automation equipment and automated warehouse systems, and revamping our development and production frameworks. By strategically allocating limited management resources to business domains with strong profitability and growth potential, we aim to generate returns that exceed our cost of capital. At the same time, we remain committed to delivering stable and sustained shareholder returns, while improving capital efficiency and enhancing shareholder value.
As EV market growth slows, automakers are revising their strategies, leading to delays of approximately three to five years in the launch of new vehicle models. In addition, the number of models is expected to decline due to development freezes. These trends are expected to intensify competition among interior product suppliers. We view this transitional period as an opportunity to build future earning power and lay the foundation for success beyond 2030. To achieve high-quality growth, we are focusing on initiatives such as optimizing the value chain, investing in advanced technologies and human capital, and leveraging digital technologies including AI. Through strategic capital allocation, we aim to drive sustainable business growth and improve profitability over the medium to long term.
Returns for our shareholders
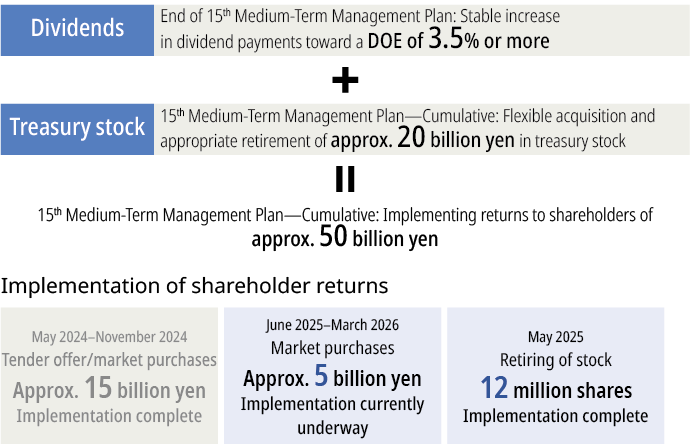
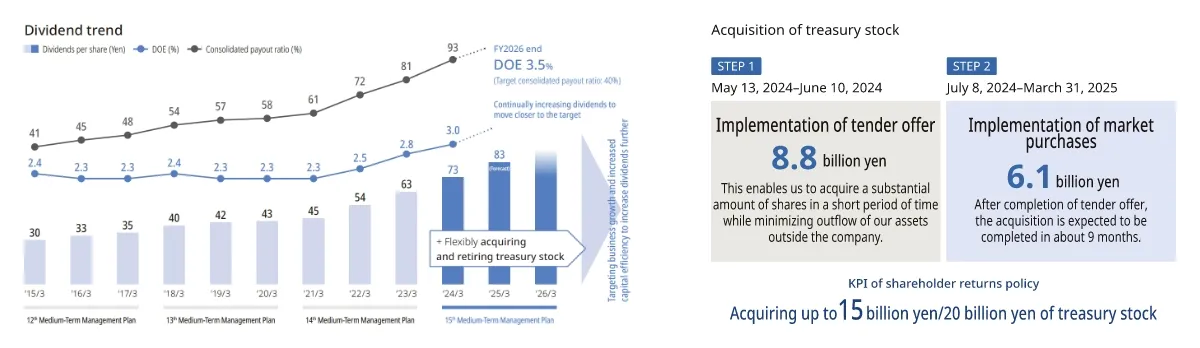
At TS TECH, delivering returns to shareholders is positioned as a key management priority. Based on our fundamental policy of implementing sustained, stable returns unaffected by business results, independent of short-term performance, we plan to steadily increase dividends to achieve a DOE* of 3.5% or more (approximately 30 billion yen) by the end of the 15th Medium-Term Management Plan (fiscal 2026). In addition, through flexible acquisition and retirement of treasury stock totaling 20 billion yen, we plan to deliver total shareholder returns of approximately 50 billion yen over the three-year period of the 15th Medium-Term Management Plan.
Based on this policy, the dividend for fiscal 2025 was 83 yen per share (up 10 yen year on year), and we plan to increase it to 90 yen per share in fiscal 2026 (up 7 yen year on year). This would mark 14 consecutive years of dividend increases and is expected to achieve a DOE* of 3.5% or more.
We acquired 15 billion yen in treasury stock during fiscal 2025 and plan to acquire an additional 5 billion yen in fiscal 2026, for a total of 20 billion yen. At the end of May 2025, we retired 12 million shares previously acquired. These actions are progressing as planned under the 15th Medium-Term Management Plan, which targets total shareholder returns of 50 billion yen over three years. Although major changes are anticipated in the business environment going forward, we will maintain our basic policy on shareholder returns, aiming to deliver sustained, stable returns for shareholders from medium- to long-term perspectives.
※ Dividend on equity ratio (DOE) = Total dividends / Shareholders’ equity (Equity attributable to owners of parent)
Toward sustainable enhancement of corporate value
As of March 31, 2025, TS TECH’s price-to-book ratio (PBR) stood at 0.65 (stock price: 1,680 yen), a level we recognize does not sufficiently reflect stakeholder expectations. This is attributable to several factors, including the challenging conditions facing the automotive industry as a whole, a gap between our profit targets under the 15th Medium-Term Management Plan and actual performance, caused by production cuts at automakers, and continued ROE below our cost of capital—highlighting the need to improve capital efficiency.
To overcome this situation, it is essential to improve our ROE—our earning ability—beyond the cost of capital. Achieving this will require the steady execution of our nine priority strategies and greater resilience in responding to changes in the business environment. In particular, organizational strength that enables us to swiftly and flexibly plan and implement initiatives is critical. To support this, we are actively investing in digital technologies and, in line with our TS TECH Philosophy of being “A company dedicated to realizing people’s potential,” enhancing our investments in human capital and employee engagement. These efforts are key to driving sustainable growth and long-term profitability.
By enhancing our ability to generate returns and improve capital efficiency, through all these initiatives, we will achieve a PBR of 1 at the earliest opportunity, aiming to fulfill the role expected not only by the capital markets but by all our stakeholders as “A company sincerely appreciated by all.” Going forward, we will continue to make unremitting efforts to achieve this goal.
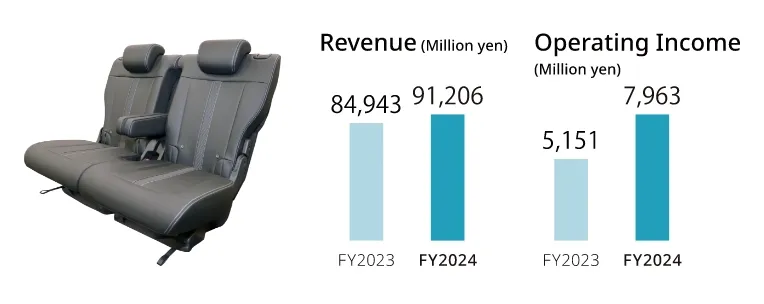
Results by segment for fiscal 2025
Japan
This fiscal year, we began producing seats for the new Honda Freed, rear seats for the new Honda N-Box Joy, and other models. By stepping up the automation of production lines, consolidating domestic subsidiaries responsible for component production, promoting technological co-creation, and streamlining processes, we will establish a more efficient production structure.
The Americas
This fiscal year, we began producing seats for the new Honda Civic Si and other models. We are working steadily to improve profits by introducing automated facilities, and improving the utilization rates by reducing production losses. We will work hard to boost profitability by advancing the automation of production lines, looking ahead to the launch of next-generation models.
China
This fiscal year, we began producing front seats for the new Honda S7 and other models. To strengthen TS TECH’s presence in the increasingly competitive Chinese market, we are working with competitive local suppliers, setting in place an agile local development framework adapted to local needs, and working to increase our share of business with major customers and to secure new commercial rights.
Asia and Europe
This fiscal year, we began producing front seats for the new Honda Amaze and other models. In the Indian market, which is growing dramatically, we have not only expanded production capacity by establishing a new plant but have also made the decision to establish a joint venture with the Krishna Group, a major supplier of seats to Maruti Suzuki India, with the aim of securing further commercial rights.