Environmental Targets and Results
Long-term environment targets
In the interest of protecting the global environment, the Group will work to reduce the environmental impact of all aspects of its corporate activities. Our efforts to build a sustainable world are guided by our vision statement of being “a company dedicated to realizing people’s potential” and “a company sincerely appreciated by all.” We aim to strike a balance between achieving further business growth and contributing to the resolution of social issues, including the creation of a recycling-oriented society and conservation of water resources, in addition to responding to climate change, which is becoming more serious by the year. Accordingly, we have set long-term targets for such environmental issues. The whole Group will work to achieve these goals by promoting environmental conservation activities.
| Item | KPI | Term for comparison | 2030 target | 2050 target |
|---|---|---|---|---|
| CO2 | CO2 emissions reduction rate*1 | Compared with FY2020 | -50% | -100% |
| Waste | Waste reduction rate*2 | Compared with FY2020 | -50% | -100% |
| Water | Water intake and wastewater reduction rates*3 | Compared with FY2020 | Water intake reduction rate -50% | Wastewater reduction rate -100% |
| Environmental impact of wastewater*4 | – | Zero | Zero |
- CO2 emissions reduction rate (Scope 1 and 2) resulting from the Group’s business activities
- Reduction rate for waste resulting from the Group’s manufacturing activities (excluding residue, sludge, etc.)
- Reduction rate of water intake (amount used) at the Group’s production facilities and reduction of wastewater resulting from manufacturing activities
- Environmental impact of wastewater resulting from the Group’s manufacturing activities
Carbon Neutrality Initiatives
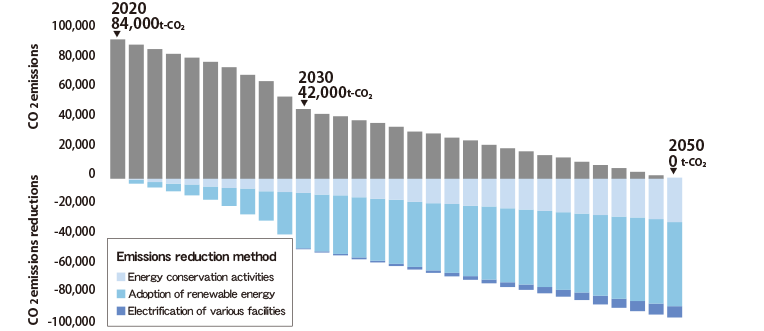
To achieve carbon neutrality in our business activities by 2050, we aim to significantly reduce our Scope 2 emissions, while working on energy conservation activities and the adoption of renewable energy. As part of our energy conservation activities, we will strive to improve the efficiency of our production equipment by developing new production technologies, by switching to the latest equipment, and by installing inverters. Moreover, we will adopt renewable energy technology, such as solar power systems, purchase renewable electricity based on regional characteristics, and utilize green electricity certificates.
To reduce Scope 1 emissions, we plan to electrify Group facilities starting around 2030, when various environmental technologies are expected to become widespread. We aim to achieve carbon neutrality by electrifying our facilities that use fossil fuels such as natural gas, by replacing conventional company vehicles with EVs, and adopting ZEB* standards when constructing or renovating factories.
- The aim of a Zero-Energy Building (ZEB) is to reduce the building’s CO2 emissions from energy consumption to zero. This is done by adopting renewable energy technology, while realizing significant energy savings and maintaining the quality of the indoor environment
Future projections of CO2 emissions and reduction methods
| 15th Medium-Term Management Plan (FY2024–FY2026) |
Medium-term plan (2030) |
Long-term plan (2050) |
||
|---|---|---|---|---|
| CO2 emissions reduction target (Scopes 1&2) |
Reduction of 25% compared to FY2020 | Reduction of 50% compared to FY2020 | Achieving carbon neutrality | |
| Main initiatives | Energy conservation activities |
Improving production and business processes, optimizing air conditioning and lighting, upgrading to high-efficiency equipment, and enhancing environmental management, etc. | ||
| Adoption of renewable energy |
Installing solar power systems, purchasing renewable electricity, utilizing green electricity certificates, and utilizing power storage batteries, etc. | |||
| Raising the electrification rate |
Replacing equipment powered by gas or heavy fuel oil, and replacing conventional vehicles with EVs, etc. | |||
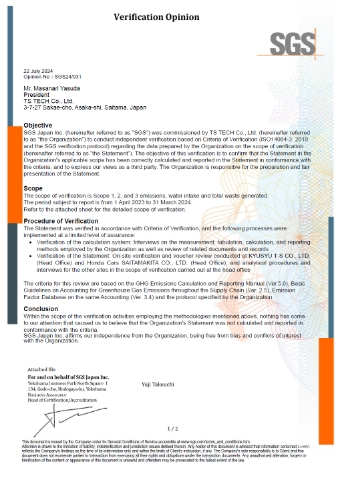
Implementing Third-Party Verification
In order to ensure the reliability environmental data disclosure, the Group has obtained third-party verification from SGS Japan Inc. Verification results for fiscal 2023 are as follows.
| Verification target | Verification range | Results |
|---|---|---|
| Scopes 1 and 2 (CO2 emissions from energy use) and energy consumption | 6 sites of the Organization, 6 domestic companies, 31 overseas companies | Scope1: 7,020 t-CO2 Scope2:51,527 t-CO2 |
| Scope 3, Category 1 (CO2 emissions from purchased products and services) |
Products and services extracted from TS production control system | 2,602,605 t-CO2 |
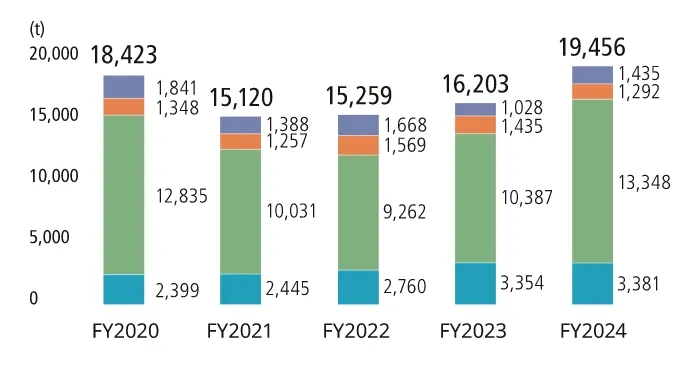
| Waste generated (including valuable waste) | 6 sites of the Organization, 6 domestic companies, 30 overseas companies | 19,456 t |
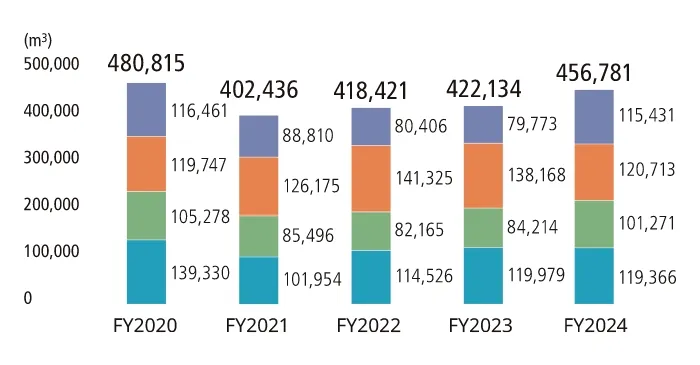
| Water intake | 456,781 m3 |
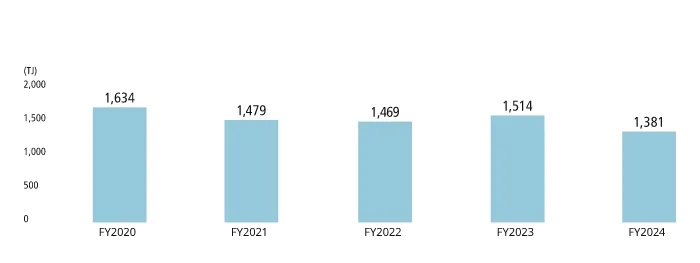
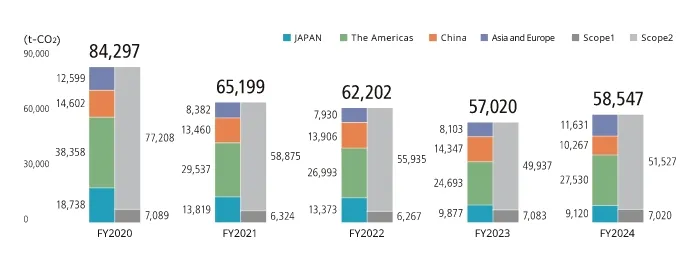
The TS TECH Group’s Environmental Data
Energy Input
CO2 Emissions
Waste Generated
Water Intake
-
Scope of data: Consolidated sites excluding certain subsidiaries.
(FY2024)- Energy input and CO2 emissions: 33 out of 38 consolidated subsidiaries are included in the data scope (5 companies are excluded)
- Waste emissions and water intake: 32 out of 38 consolidated subsidiaries are included in the data scope (6 companies are excluded)
- The revenue of the companies within the data scope accounts for 95% or more of the Group’s consolidated revenue for each period concerned.
Ratio of the sales for the companies within the data scope to the Group’s consolidated sales revenue
| FY2021 | FY2022 | FY2023 | FY2024 | |
|---|---|---|---|---|
| Energy input and CO2 emissions Sales ratio of companies within the data scope | 97.4% | 96.7% | 99.5% | 100% |
| Waste generated and water intake Sales ratio of target companies | 97.4% | 96.6% | 99.5% | 99.9% |
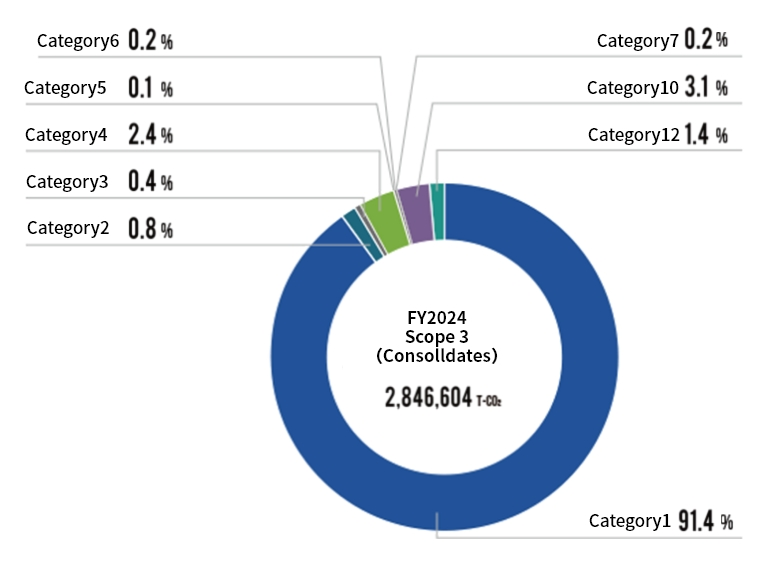
Scope 3 emissions (consolidated)
| Category | Emissions (t-CO2) |
Ratio (%) |
|---|---|---|
| 1. Purchased goods and services | 2,602,605 | 91.4% |
| 2. Capital goods | 21,566 | 0.8% |
| 3. Fuel and energy related activities not included in Scope1 & Scope2 | 11,088 | 0.4% |
| 4. Transportation and distribution (upstream) | 69,065 | 2.4% |
| 5. Waste generated in operations | 3,536 | 0.1% |
| 6. Business travel | 6,654 | 0.2% |
| 7. Employee commuting | 5,975 | 0.2% |
| 8. Leased assets (upstream) | 0 | 0.0% |
| 9. Transportation and distribution (downstream) | 0 | 0.0% |
| 10. Processing of sold products | 87,293 | 3.1% |
| 11. Use of sold products | 0 | 0.0% |
| 12. End-of-life treatment of sold products | 38,822 | 1.4% |
| 13. Leased assets (downstream) | 0 | 0.0% |
| 14. Franchises | 0 | 0.0% |
| 15. Investments | 0 | 0.0% |
| Other | 0 | 0.0% |
| Total | 2,846,604 | 100% |
Changes in Scope 3 emissions
(t-CO2)
| FY2021 | FY2022 | FY2023 | FY2024 |
|---|---|---|---|
| 2,381,086 | 2,658,732 | 2,583,409 | 2,846,604 |
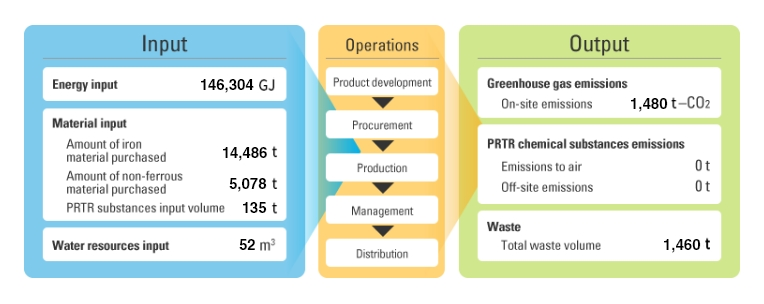
Material Flow
FY2024 Material Flow
Fiscal 2024 Environmental Accounting
Environmental Conservation Cost (Non-consolidated)
(Unit: Million yen)
| Item | Main Efforts | FY2022 | FY2023 | FY2024 | ||||
|---|---|---|---|---|---|---|---|---|
| Investment | Cost | Investment | Cost | Investment | Cost | |||
| Business area cost | Pollution prevention cost | Prevention of air, water, and soil pollution, etc. | 21 | 15 | 22 | 27 | 4 | 27 |
| Global environmental conservation cost | Prevention of global warming and ozone depletion and other environmental preservation efforts | 561*1 | 71 | 596*2 | 32 | 440*3 | 58 | |
| Resource circulation cost | Recycling, waste treatment and disposal, and water-saving efforts | 13 | 59 | 1 | 67 | 4 | 83 | |
| Upstream/downstream cost | Costs generated from purchasing low environmental impact products and raw materials | 7 | 3 | 3 | 1 | - | 1 | |
| Administration cost | EMS development & operation costs, environmental measurement costs,office interior “greening” and development costs | 48 | 46 | 46 | 74 | 24 | 81 | |
| R&D cost | Research and development of new technology with a high positive environmental impact, such as reducing the weight of products, reducing VOCs (not using paints), and developing recyclable materials | 2 | 4,447 | 14 | 4,215 | 37 | 4,952 | |
| Social activity cost | Environmental measures such as nature protection, “greening,” and scenery preservation | 1 | 1 | – | 2 | – | 3 | |
| Environmental remediation cost | Remediation of soil pollution, etc. | – | – | – | – | – | – | |
| Total | 652 | 4,642 | 682 | 4,418 | 509 | 5,205 | ||
- Expenses related to construction of the new building at the Hamamatsu Plant
- Expenses related to solar power generation equipment at the Saitama, Hamamatsu, and Suzuka plants
- Expenses related to solar power generation equipment at the Saitama and Hamamatsu plants
- The scope of the survey is TS TECH Co., Ltd. and its domestic consolidated subsidiaries.
- The above figures include portions ascertained by estimation, such as apportionment.
- Materials related to environmental accounting, such as guidelines and guidebooks published by the Ministry of the Environment of Japan, were referenced when preparing the table.
- Costs do not include depreciation costs.
Economic Effects (Non-consolidated)
(Unit: Thousand yen)
| Item | FY2022 | FY2023 | FY2024 |
|---|---|---|---|
| Gain on sale of valuables | 9,654 | 13,645 | 11,607 |
| Cost saved by energy conservation | 3,448 | 3,975 | 1,727 |
| Total | 13,102 | 17,620 | 13,334 |
Material Effects (Non-consolidated)
| Item | FY2022 | FY2023 | FY2024 |
|---|---|---|---|
| Energy consumption (GJ) | 161,867 | 164,634 | 146,304 |
| Water consumption (1,000m3) | 51 | 54 | 52 |
| CO2 emissions (t-CO2) | 4,903 | 2,581 | 1,480 |
| CO2 emissions due to transportation(t-CO2) | 1,467 | 1,431 | 1,624 |
| Total waste output (t) | 1,384 | 1,495 | 1,460 |
| VOC emissions (t) | 18 | 27 | 30 |
| PRTR emissions (t) | 0 | 0 | 0 |
Water Pollution Control Law, Sewerage Law
The TS TECH Group periodically monitors the release of water discharged to public water areas and drainage that soaks into the ground from each business site to confirm that the Group is in compliance with effluent standards.
Water Quality Indicators in FY2024
| Item | Unit | Technical Center | Saitama Plant | Component Business Department | Hamamatsu Plant | Suzuka Plant | |||||
|---|---|---|---|---|---|---|---|---|---|---|---|
| Regulatory standards | Results | Regulatory standards | Results | Regulatory standards | Results | Regulatory standards | Results | Regulatory standards | Results | ||
| Hydrogen ion concentration | PH | 6.0–8.4 | 7.3 | 5.0–9.0 | 8.5 | 5.0–9.0 | 7.8 | 5.8–8.6 | 7.0 | 5.8–8.6 | 6.7 |
| Biochemical oxygen demand (BOD) | mg/L | 10 | 3.3 | (600)* | 360 | (600)* | 12 | 160 | 158 | 20 | 11 |
| Suspended solids | mg/L | 25 | 1.8 | (600)* | 190 | (600)* | 9 | 200 | 106 | 70 | 5 |
- Some regulation values are self-imposed.
PRTR Act (The Act on Confirmation, etc. of Release Amounts of Specific Chemical Substances in the Environment and Promotion of Improvements to the Management Thereof)
Based on the PRTR Act, the TS TECH Group reports annually the amount of chemical substances emitted into the air. There have been no incidents or problems to date.
Handling of PRTR Substances in FY2024
| Saitama Plant | Hamamatsu Plant | Suzuka Plant | |
|---|---|---|---|
| Amount handled (t) | 23 | 59 | 53 |
| Amount emitted into air (t) | 0 | 0 | 0 |
| Amount transferred (t) | 0 | 0 | 0 |